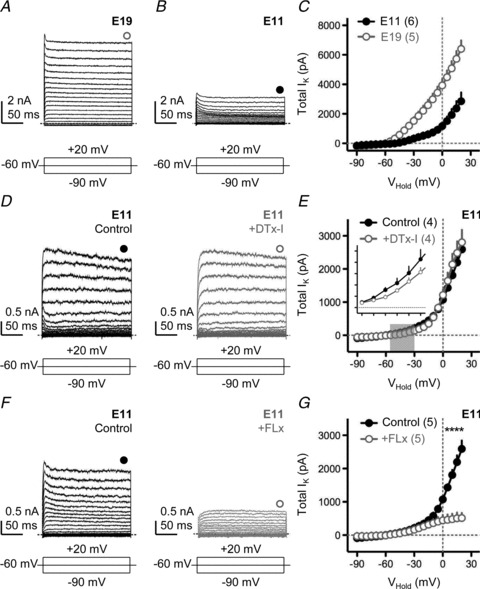
Figure 2. Minimal contribution of low-voltage-activated potassium currents early in development.

A and B, representative voltage-clamp traces of isolated K+ currents for E19 (A) and E11 (B) NL neurons. C, population current–voltage (I–V) curves for E19 and E11 NL neurons. D, representative voltage-clamp traces of isolated K+ currents for an E11 NL neuron before (left, black traces) and after (right, grey traces) bath application of a specific KLVA blocker (DTx-I, 0.1 μm). E, population I–V curves for E11 neurons before and after DTx-I application. Grey shaded region indicates voltage range (−55 mV to −30 mV) used to determine the average amount of K+ current that was sensitive to bath application of DTx-I (inset). Inset Y-axis tick marks are 0 to 250 pA in steps of 50 pA: X-axis are −55 to −30 mV in steps of 5 mV. F, representative traces for another E11 NL neuron before (left, black traces) and after (right, grey traces) application of a specific KHVA blocker (FLx, 100 μm). G, population I–V curves for E11 before and after FLx. In A, B, D and F, neurons were held at −60 mV and stepped from −90 mV to +20 mV (steps of 5 mV, duration 200 ms). Schematic lines under traces represent the holding, minimal and maximal voltages (minimized for clarity) injected into the soma. Filled and open circles above traces represent time point taken (averaged across 5 ms) to construct steady-state I–V curves shown in C, E and G. All experiments were performed in the presence of DNQX, dl-APV, PTX and TTX. In this and subsequent figures: *P < 0.05, **P < 0.01, ***P < 0.001, paired t test. Numbers in parentheses, n.
