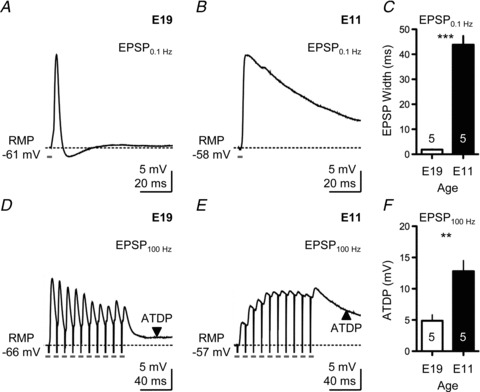
Figure 3. Developmental differences in excitatory postsynaptic potentials (EPSPs) following afferent stimulation.

A, representative current-clamp trace showing the EPSP of an E19 NL neuron following low-frequency stimulation (0.1 Hz). B, representative current-clamp trace showing the EPSP of an E11 NL neuron following low-frequency stimulation (0.1 Hz). C, population data showing changes in the width of EPSPs measured at half-maximal amplitude for E19 and E11 NL neurons following low-frequency stimulation (0.1 Hz). D, representative current-clamp trace showing the EPSP of an E19 NL neuron elicited by a train of 10 pulses delivered at a rate of 100 Hz. Pulse train repeated every 10 s. E, representative current-clamp trace showing the EPSP of an E11 NL neuron elicited by a train of 10 pulses delivered at a rate of 100 Hz. Pulse train repeated every 10 s. F, population data showing changes in ATDP for E19 and E11 NL neurons following high-frequency stimulation (100 Hz). In A, B, D and E, traces are averaged across a minimum of 5 stimulus presentations. Stimulus intensity was adjusted to half the strength needed to elicit an AP, followed by TTX bath application.
