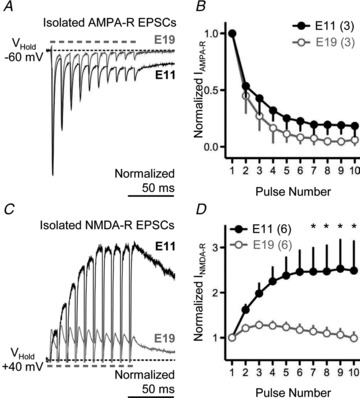
Figure 4. Developmental differences in excitatory postsynaptic currents (EPSCs) following rapid afferent stimulation.

A, superimposed voltage-clamp traces of isolated AMPA-R-mediated EPSCs for E19 (grey trace) and E11 (black trace) NL neurons elicited by a train of 10 pulses delivered at a rate of 100 Hz. Pulse train repeated every 10 s. B, population data for isolated AMPA-R-mediated EPSCs for E19 and E11 NL neurons. C, superimposed voltage-clamp traces of isolated NMDA-R-mediated EPSCs for E19 (grey trace) and E11 (black trace) NL neurons elicited by a train of 10 pulses delivered at a rate of 100 Hz. Pulse train repeated every 10 s. D, population data for isolated NMDA-R-mediated EPSCs for E19 and E11 NL neurons. In A and C, traces are averaged across a minimum of 5 stimulus presentations.
