
Figure 5. Developmental differences in glutamate clearance at NL synapses.
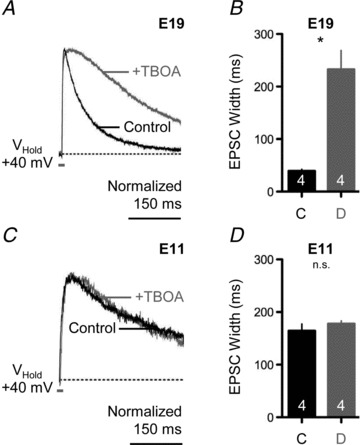
A, representative voltage-clamp traces of isolated NMDA-R-mediated EPSCs for an E19 NL neuron before (black traces) and after (superimposed grey traces) bath application of a glutamate transporter antagonist (+TBOA, 100 μm). Afferent stimulation rate, 0.1 Hz. B, population data showing changes in the time to half-maximal amplitude width of the NMDA-R-mediated EPSC before (C, control) and during (D, drug) bath application of TBOA for E19 NL neurons. C, representative voltage-clamp traces of isolated NMDA-R-mediated EPSCs for an E11 NL neuron before (black traces) and after (superimposed grey traces) bath application of a glutamate transporter antagonist (+TBOA, 100 μm). Afferent stimulation rate, 0.1 Hz. D, population data showing changes in the time to half-maximal amplitude width of the NMDA-R-mediated EPSC before (C, control) and during (D, drug) bath application of TBOA for E11 NL neurons. In A and C, traces are averaged across a minimum of 5 stimulus presentations. In B and D, number in bar represents n. In this and subsequent figure, n.s., not significant.