
Figure 6. Neuronal excitability is controlled by NMDA-Rs in early developing NL neurons.
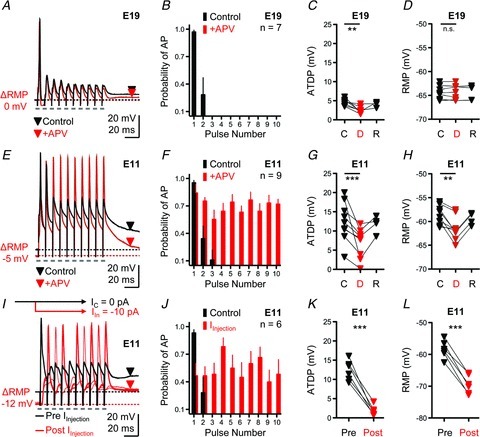
A, representative current-clamp traces for an E19 NL neuron before (black traces) and after (superimposed red traces) bath application of an NMDA-R antagonist (+dl-APV, 100 μm). Stimulation, 10 pulses at a rate of 100 Hz, repeated every 10 s. ΔRMP is the change in resting membrane potential after application of dl-APV used to derive data shown in D. Black and red downward arrowheads (control and drug traces, respectively) represent time points (averaged across 10 ms window) used to derive data shown in C. B, population data for E19 NL neurons showing the probability of action potential occurrence as a function of pulse number during a 100 Hz train before (Control, black bars) and after (+APV, red bars) drug application. C, population data showing changes in ATDP before (C, control), during (D, drug) and after (R, recovery) bath application of dl-APV for E19 NL neurons. D, population data showing changes in RMP before (C), during (D) and after (R) bath application of dl-APV for E19 NL neurons. E, representative current-clamp traces for an E11 NL neuron before (black traces) and after (superimposed red traces) bath application of an NMDA-R antagonist (+dl-APV, 100 μm). Stimulation, 10 pulses at a rate of 100 Hz, repeated every 10 s. ΔRMP, change in resting membrane potential after application of dl-APV used to derive data shown in H. Black and red downward arrowheads (control and drug traces, respectively) represent time points (averaged across 10 ms window) used to derive data shown in G. F, population data for E11 NL neurons showing the probability of action potential occurrence as a function of pulse number during a 100 Hz train before (Control, black bars) and after (+APV, red bars) drug application. G, population data showing changes in ATDP before (C), during (D) and after (R) bath application of dl-APV for E11 NL neurons. H, population data showing changes in RMP before (C), during (D) and after (R) bath application of dl-APV for E11 NL neurons. I, representative traces for an E11 NL neurons before (Pre IInjection, black trace) and after (Post IInjection, red traces) somatic current injection. Black schematic line with arrow shown above traces represents control holding current (IC= 0 pA). Red schematic line with arrow shown above traces represents hyperpolarizing current injected into soma (IIn=−10 pA). ΔRMP, change in resting membrane potential after somatic injection of a hyperpolarizing current. Black and red downward arrowheads (control and current injection traces, respectively) represent time points (averaged across 10 ms window) used to derive data shown in K. J, population data for E11 NL neurons showing the probability of action potential occurrence as a function of pulse number during a 100 Hz train before (Control, black bars) and after (IInjection, red bars) somatic current injection. K, population data showing changes in ATDP before (Pre) and during (Post) hyperpolarizing somatic current injections for E11 NL neurons. L, population data showing changes in RMP before (Pre) and during (Post) hyperpolarizing somatic current injections for E11 NL neurons. Recovery traces in A, E and I not shown for clarity.