
Figure 7. Developmental differences in current–voltage (I–V) curves of isolated NMDA-R-mediated EPSCs.
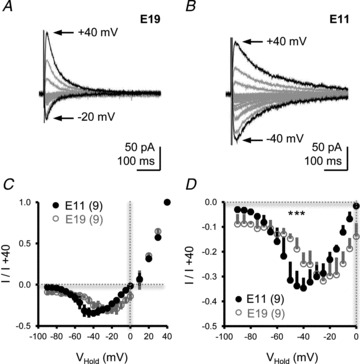
A and B, representative voltage-clamp traces of isolated NMDA-R-mediated EPSCs for E19 (A) and E11 (B) NL neurons. Neurons were voltage-clamped from −90 mV to +40 mV (steps of 5–10 mV). Black traces in A and B show maximum EPSCs at hyperpolarizing (E19, −20 mV; E11, −40 mV) and depolarizing (E19 and E11, +40 mV) holding potentials. Afferent stimulation rate, 0.1 Hz. Traces are averaged across a minimum of 5 stimulus presentations. C, population I–V curves for E19 and E11 NL neurons normalized to the isolated NMDA-mediated EPSC recorded at +40 mV. D, close-up of population I–V curves shown in C at holding voltages between −90 mV and 0 mV.