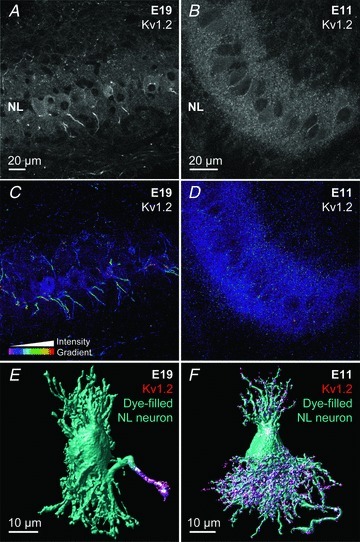
Figure 8. Developmental differences in the expression of low-voltage-activated K+ channels.

A and B, projection images (10 optical sections, 0.3 μm each) showing anti-Kv1.2 immunoreactivity at E19 (A) and E11 (B) in NL. C and D, intensity profile of optical density for the same tissue sample shown in A and B. 3-D image stack was taken throughout the entire 35 μm sections and shows Kv1.2 expression in NL over several cell layers of E19 (C) and E11 (D). E and F, single cell electroporation combined with immunohistochemistry showing Kv1.2 expression predominantly on the proximal axon at E19 (E) and on dendrites at E11 (F).
