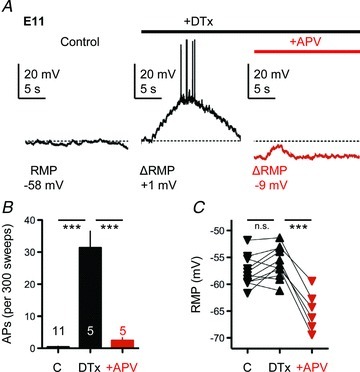
Figure 9. Low-voltage-activated K+ channels prevent NMDA-R-mediated run-away depolarization.

A, representative current-clamp traces (20 s windows) from an individual E11 NL neuron showing changes in spontaneous membrane voltages between control condition (left, black trace), DTx-I application (0.1 μm, middle, black trace) and subsequent dl-APV application (100 μm, right, red trace). Bars above traces represent relative time course of drug application (black bar, +DTx-I; red bar, +dl-APV). Baseline RMP (dashed line) and changes in RMP (ΔRMP) after drug applications are shown. B, population data showing changes in the generation of spontaneous APs during the different recording conditions (C, control; DTx, KLVA block; +APV, NMDA-R block). C, population data showing changes in the baseline RMP during the different recording conditions.
