
Figure 2. Input resistance and membrane time constant decrease with age.
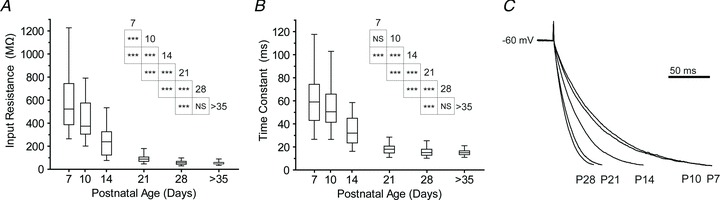
A and B, box and whisker plots show input resistance (A) and membrane time-constant (B) of BLA principal neurons across the first postnatal month and in adulthood (n= 45 (P7), 37–39 (P10), 53–54 (P14), 43–45 (P21), 56–58 (P28), and 54–56 (P > 35)). Significance was assessed using Wilcoxon's rank-sum test and pairwise comparisons were made for each age group with up to four neighbouring time points (see inset tables for results) using a Bonferroni correction for the resulting 9 comparisons (***P < 0.001; NS: not significant, P > 0.05). C, maturation of membrane time constant is illustrated with the average, normalized membrane charging in response to a small, hyperpolarizing current step (approximately 5 mV deflection) for each developmental time point (n= 48 (P7), 28 (P10), 56 (P14), 45 (P21), and 58 (P28)).