
Figure 5. Contribution of Ih to intrinsic resonance of BLA principal neurons changes with age.
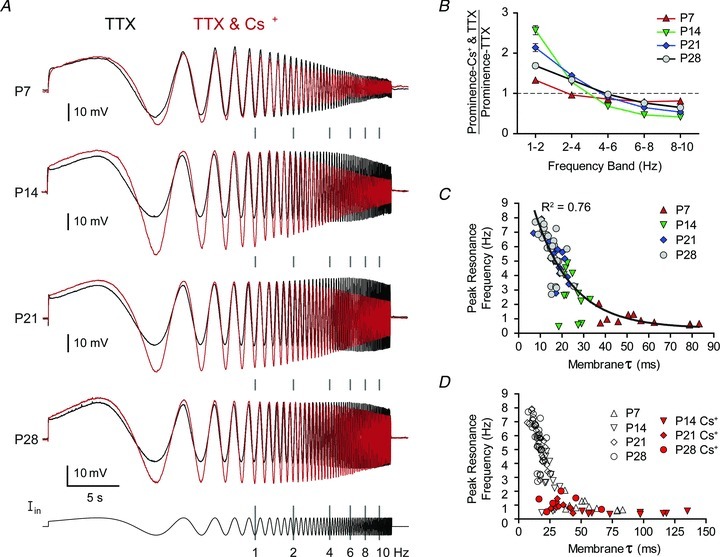
A, mean membrane potential response to a ZAP current (Iin, fixed amplitude and logarithmically increasing frequency, shown at bottom) in 1 μm TTX alone (black line, taken from Fig. 6) or with 5 mm Cs+ (red line) is depicted for each age (in Cs+, n= 19 at P7, 21 at P14, 20 at P21, and 17 at P28). Neurons were first hyperpolarized to −70 mV with direct current, and ZAP current amplitude was adjusted for each neuron and condition to elicit a 20 mV, maximal depolarizing deflection. Instantaneous frequency of the injected current is highlighted with grey bars between traces. B, effect of Cs+ application on prominence, calculated as ratio of the prominence before and after Cs+ application, plotted as mean and SEM at P7, P14, P21 and P28. C and D, peak resonance frequency is plotted against membrane time constant (τ) for neurons at each time point, recorded in TTX alone (C and D) or following application of 5 mm Cs+ (D). A black line depicts the results of an exponential regression (R2= 0.76) of the data shown in C.