
Figure 7. Maturation of spike trains in BLA principal neurons.
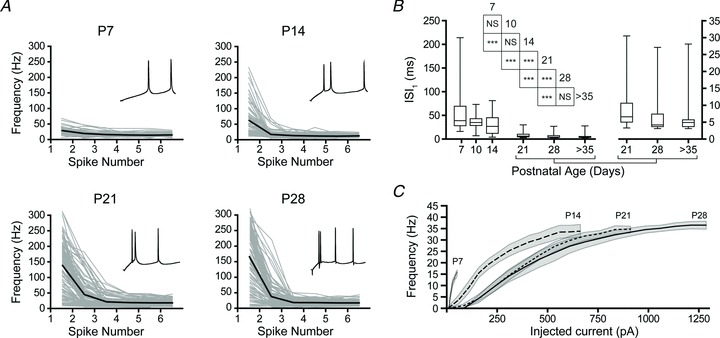
A, instantaneous action potential frequency is plotted for individual neurons (grey lines) and group mean (black lines) at each time point. Neurons were depolarized such that the mean inter-spike membrane potential was near spike threshold (see Methods for details). The start of a representative spike train is inset in each plot to highlight differences in initial spike rate (n= 39 (P7), 75 (P14), 97 (P21), and 103 (P28) trains). B, first interspike-interval for the spike trains in A is depicted in a box and whisker plot, with the later time points shown on both y-axes (n= 45 (P7), 37 (P10), 53 (P14), 43 (P21), 54 (P28), and 59 (P > 35)). Significance was assessed using Wilcoxon's rank-sum test and pairwise comparisons were made for each age group with up to 4 neighbouring time points (see inset table for results) using a Bonferroni correction for the resulting 9 comparisons (***P < 0.001; NS: not significant, P > 0.05). C, input–output curves for neurons at each time point are depicted as mean (line) and standard deviation (grey band) of average firing frequency in response to a 1 s square current step from holding potential at −60 mV (n= 7 for all time points).