
Figure 2. UCL and XE-991 application give rise to opposite changes in the neuronal transfer function.
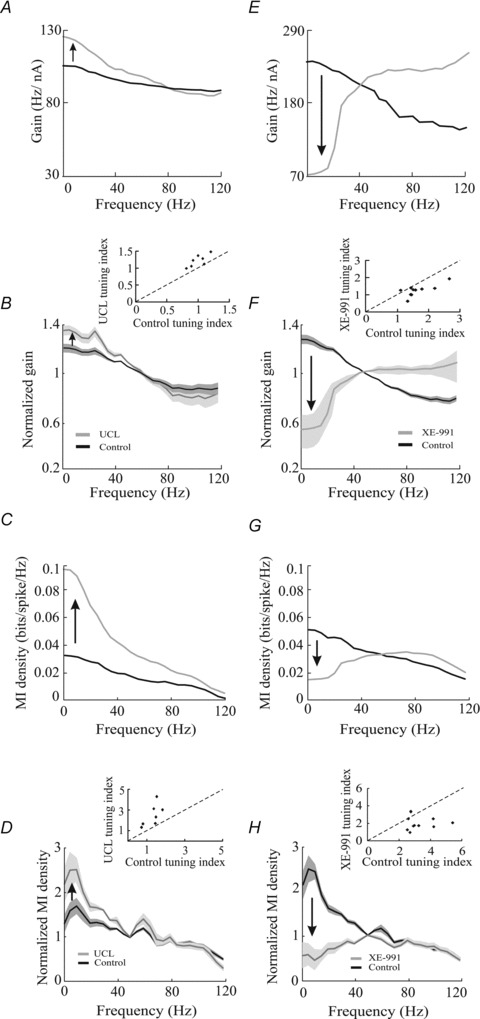
A, gain curves before (black) and after (grey) UCL application from a typical E-type electrosensory pyramidal neuron. B, normalized population-averaged gain curves before (black) and after (grey) UCL application. The bands indicate 1 SEM. Inset, scatter plot showing tuning index values obtained after UCL application as a function of those obtained under control conditions. C, mutual information (MI) density curves for the same example neuron before (black) and after (grey) UCL application from this same neuron. D, normalized population-averaged MI density curves before (black) and after (grey) UCL application. The bands indicate 1 SEM. Inset, scatter plot showing tuning index values obtained after UCL application as a function of those obtained under control conditions. E, gain curves before (black) and after (grey) XE-991 application from a typical I-type electrosensory pyramidal neuron. F, normalized population-averaged gain curves before (black) and after (grey) XE-991 application. The bands indicate 1 SEM. Inset, scatter plot showing tuning index values obtained after XE-991 application as a function of those obtained under control conditions. G, MI density curves before (black) and after (grey) XE-991 application from the same example neuron. H, population-averaged normalized MI density curves before (black) and after (grey) XE-991 application. The bands indicate 1 SEM. Inset, scatter plot showing tuning index values obtained after XE-991 application as a function of those obtained under control conditions. *Statistical significance at the P= 0.01 using a pairwise t test.