
Figure 3. UCL and XE-991 application give rise to differential changes on the frequency as a function of current (f–I) curve.
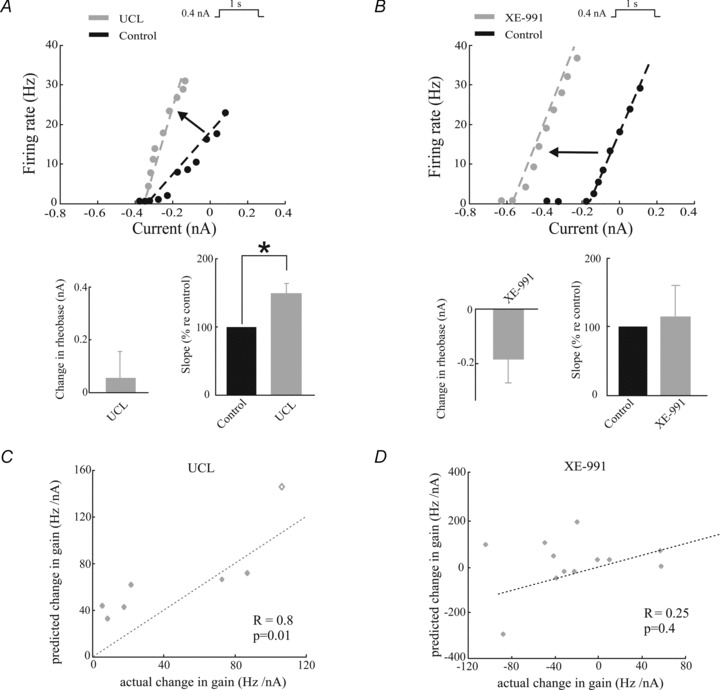
A, top, f–I curves before (black) and after (grey) UCL application from a typical electrosensory pyramidal neuron. Bottom left, population-averaged change in rheobase. Bottom right, population-averaged f–I curve slope values before and after UCL application. B, same as A, but for XE-991 application. The dashed lines were obtained by performing a linear least squares fit on the data points for which the firing rate was strictly positive. C, change in f–I curve slope (i.e. the predicted change in gain) as a function of the actual change in gain computed from time varying stimuli evaluated at zero frequency. A significant positive correlation is observed with (R= 0.8, P= 0.01, n= 7) and without (R= 0.73, P= 0.03, n= 6) the data point shown as a diamond. The dashed line is the identity line. D, same as C, but for XE-991 application. No significant correlation was observed (R= 0.25, P= 0.41, n= 12).