
Figure 5. A simple mathematical model reproduces the effects of UCL and XE-991 application on membrane excitability, burst firing, SFA, and the f–I curves.
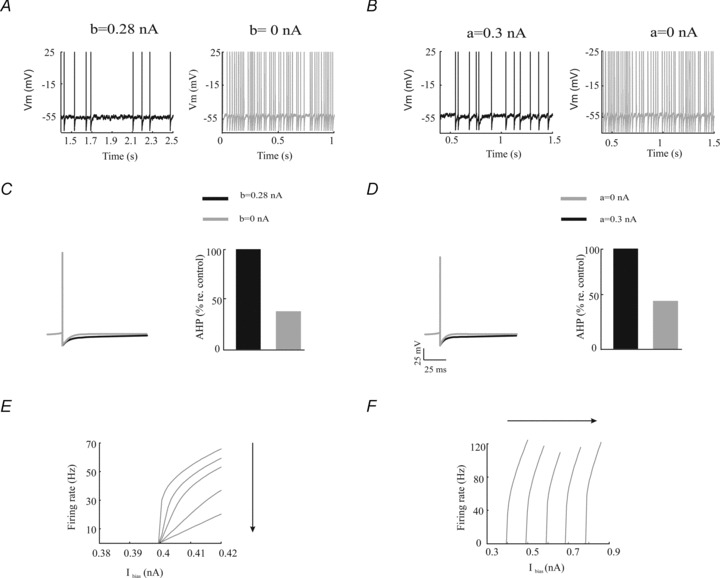
A, model membrane potential trace under control conditions (left) and after removal of the spike-triggered adaptation current (right). B, model membrane potential trace under control conditions (left) and after removal of the subthreshold adaptation current (right). C, left, average action potential shapes under control (black) and after removal of the spike-triggered adaptation current (grey). Right, AHP size under control (black) and after removal of the spike-triggered adaptation current (grey). D, left, average action potential shapes under control (black) and after removal of the subthreshold adaptation current (grey). Right, AHP size under control (black) and after removal of the subthreshold adaptation current (grey). E, model f–I curves obtained from the model by increasing the spike-triggered adaptation gain b. Parameter values were the same as those used in Fig. 4C. The different curves were obtained with b= 0, 0.33, 0.67, 0.1 and 0.133 nA. F, model f–I curves obtained from the model by increasing the subthreshold adaptation gain a. Parameter values were the same as those used in Fig. 4D. The different curves were obtained with a= 0, 0.333, 0.667, 0.1 and 0.133 nA. Other parameters values were the same as those used for Fig. 4C.