
Figure 2. Raw melatonin profiles from one subject in the control and ‘blue light’ laboratory sessions.
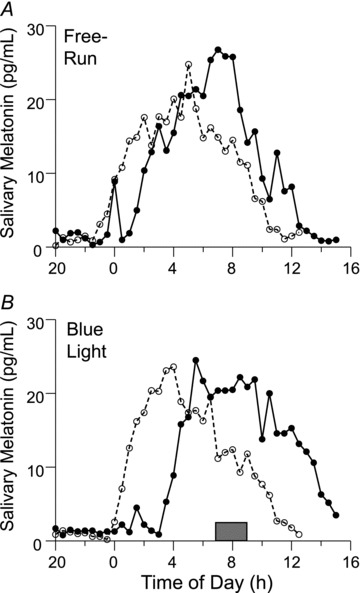
The profiles with the dashed lines and open circles are from the baseline phase assessments and the profiles with the continuous lines and filled circles are from the final phase assessments. A, control lab session without blue light. The profile delayed ∼2 h due to the free-run through the ultradian LD cycle. B, lab session in which intermittent blue light was applied once a day during the 3 days of ultradian LD cycles. The shaded rectangle over the x-axis shows the time of the blue light stimulus, from the start of the first 30 min pulse to the end of the third 30 min pulse. The profile delayed ∼3 h. Thus, the net phase shift due to the blue light alone, after subtracting out the delay from the free-run, was a delay of ∼1 h.