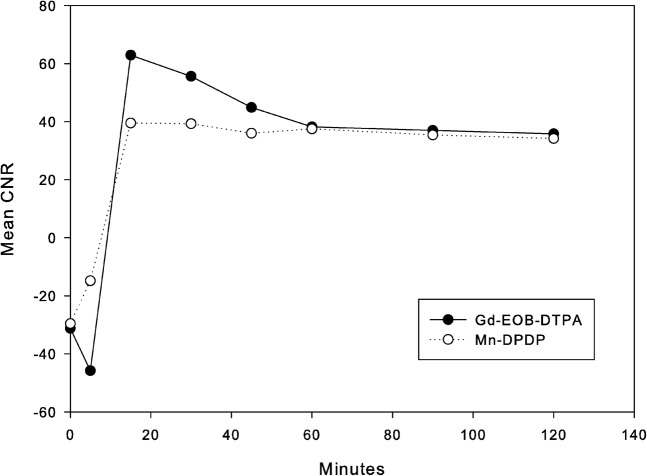
Figure 3.
Mean contrast-to-noise ratios (CNRs) of common hepatic duct to liver parenchyma. The CNR of Gd-EOB-DTPA shows an initial decline and then steep increase to a peak at 15 min, whereas the CNR of Mn-DPDP shows a steady increase to a peak at 15 min. At a peak (15 min) the CNR of the Gd-EOB-DTPA is significantly higher than that of Mn-DPDP (p<0.05). Gd-EOB-DTPA, gadolinium-ethoxybenzyl-diethylenetriamine-pentaacetic acid; Mn-DPDP, mangafodipir trisodium.

