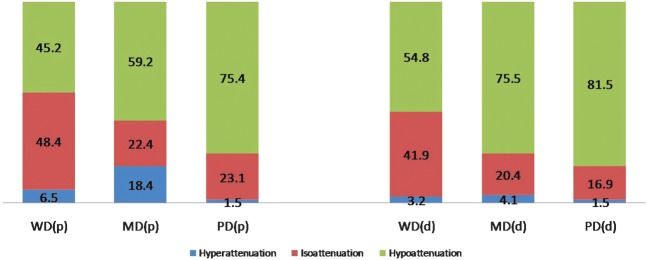
Figure 2.
Chart shows the relative timing of washout of 190 hepatocellular carcinomas (HCCs). Results show a shift towards earlier washout concurrently with progression towards advanced HCC. d, delayed phase; MD, moderately differentiated; p, portal venous phase; PD, poorly differentiated; WD, well differentiated.

