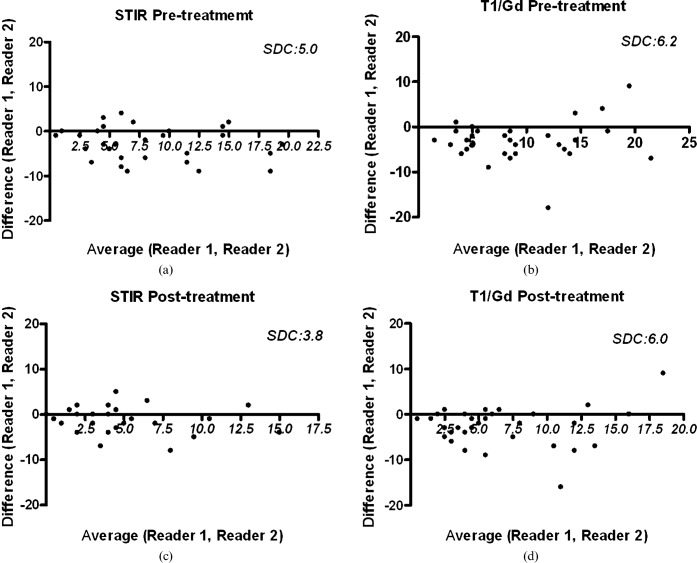
Figure 1.
Bland and Altman plots. (a) Distribution of pre-treatment ankylosing spondylitis (AS) lesion scores for the short tau inversion–recovery (STIR) technique. (b) Distribution of pre-treatment AS lesion scores for the T1 weighted gadolinium contrast-enhanced (T1/Gd) technique. (c) Distribution of post-treatment AS lesion scores for the STIR technique. (d) Distribution of post-treatment AS lesion scores for the contrast-enhanced T1/Gd technique. SDC, smallest detectable change.

