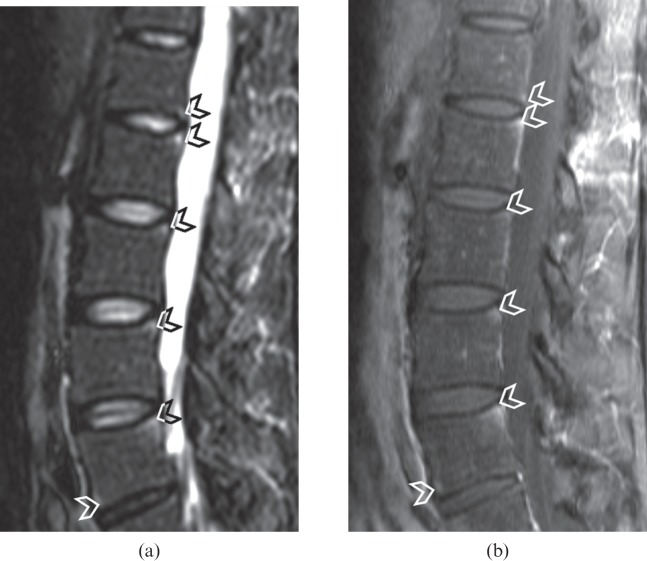
Figure 2.
(a) Short tau inversion–recovery (STIR) sagittal image of a lumbar spine showing oedema at the posteroinferior corner of the L1 vertebral body and the posterosuperior corner of the L2, L3, L4 and L5 vertebral bodies as well as the anteroinferior corner of the L5 vertebral body (arrowheads). These lesions are also depicted on (b) the contrast-enhanced T1 weighted fat-suppressed image (arrowheads), with good agreement between the two images. With the spine units L1–L5, Reader 1 had an ankylosing spondylitis spine MRI-activity score of 5 for STIR images and contrast-enhanced images, whereas Reader 2 had a score of 4 for STIR images and contrast-enhanced images.

