
Figure 3.
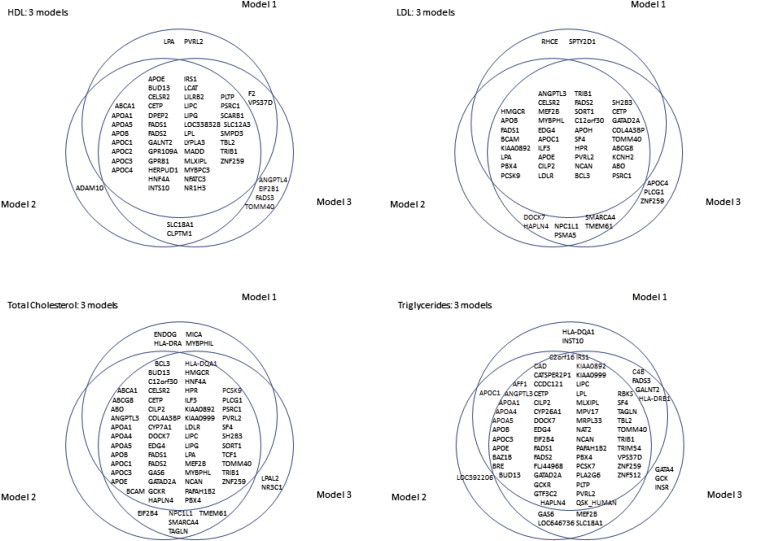
Venn Diagram per Phenotype for the Comparison of the Three Models Used
Model 1 corrects only for population stratification; model 2 corrects for population stratification, age, and lipid medication; and model 3 corrects for population stratification, age, T2D, smoking, BMI, and lipid medication. Only signals with p < 2.4 × 10⁻⁶ are included.