
Figure 2.
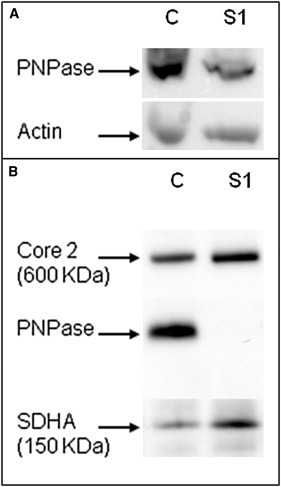
PNPase Analysis
(A) SDS-PAGE and immunoblot analysis of PNPase and actin in subject 1 (S1) and a control (C).
(B) BN-PAGE analysis of mitochondria from cultured skin fibroblasts of subject 1 (S1) and a control (C) with PNPase antibodies. SDHA (complex II) and core 2 (complex III) were used as loading controls.