
Figure 2.
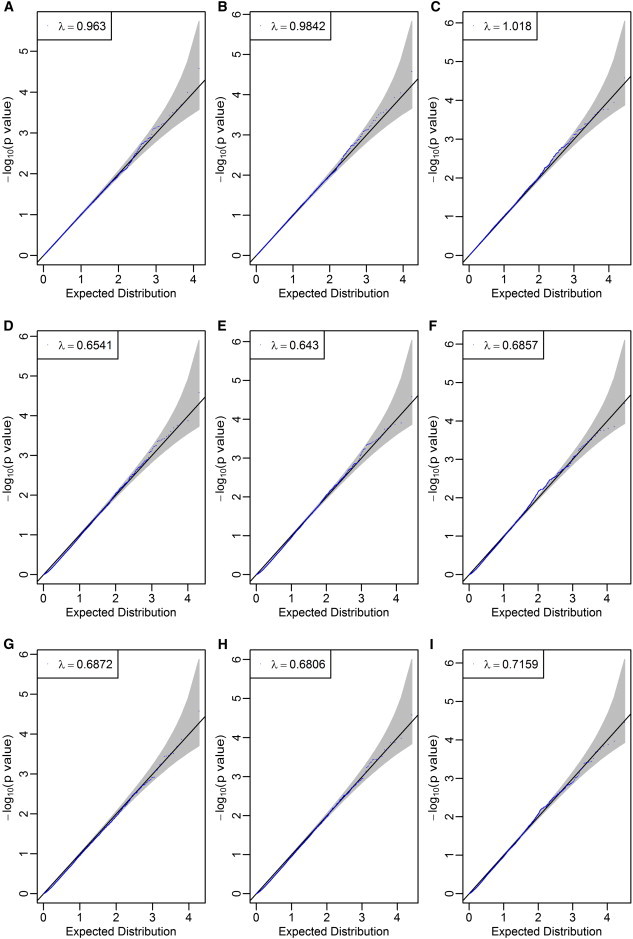
Quantile-Quantile Plots after Positional Binning and LD-Based Binning Using the 1,868 WTCCC BP Individuals and 2,938 Common Controls Randomly Assigned to Case-Control Status
(A) Positional binning with no extension.
(B) Positional binning with 1 kb extension upstream and downstream of a gene.
(C) Positional binning with 10 kb extension upstream and downstream of a gene.
(D) LD-based binning with no extension (r2 = 0.5).
(E) LD-based binning with 1 kb extension upstream and downstream of a gene (r2 = 0.5).
(F) LD-based binning with 10 kb extension upstream and downstream of a gene (r2 = 0.5).
(G) LD-based binning with no extension (r2 = 0.8).
(H) LD-based binning with 1 kb extension upstream and downstream of a gene (r2 = 0.8).
(I) LD-based binning with 10 kb extension upstream and downstream of a gene (r2 = 0.8).
The small λ values in (D–I) are caused by substantially more observed p values close to 1.