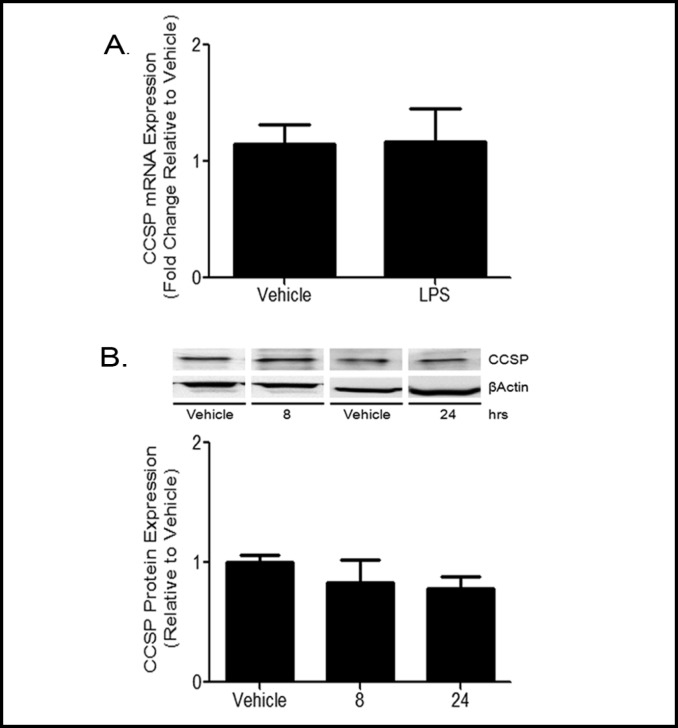
Fig. 5.
CCSP expression is not altered by LPS treatment. MTCC were treated with vehicle or 100 ng/mL LPS for 8 or 24 h. (A) Cells were harvested at 8 h and CCSP mRNA expression levels were determined by qRT-PCR. Ct values were normalized to ß-actin, and AACt were normalized to vehicle controls. Data are presented as fold change. Statistical analyses were performed on ACT values and analyzed using two tailed student's t test. Data represent means ± SEM from at least 3 independent experiments (n=13, p<0.05). (B) CCSP protein levels at 8 and 24 h were determined by Western blot using enhance chemiluminescense and autoradiography and quantified by densitometry. CCSP band density was normalized to the band density of ß-actin. Data were analyzed using two tailed student's t test. Data represents means ± SEM (normalized to vehicle controls) from at least 3 independent experiments (n=13, p<0.05).

