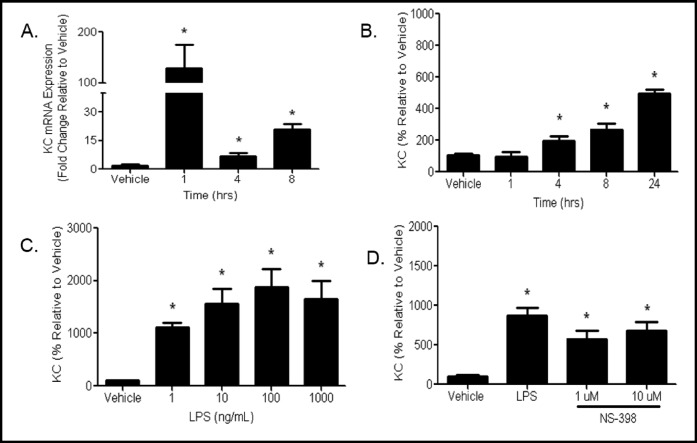
Fig. 7.
Chemokine mRNA and protein expression is increased by LPS treatment. (A) MTCC were treated with vehicle or 100 ng/mL LPS for 1, 4, or 8 h. mRNA expression levels were determined by qRT-PCR. Ct values were normalized to ß-actin, and AACt were normalized to vehicle controls. Data are presented as fold change. Statistical analyses were performed on ACt values and analyzed using two tailed student's t test (n=6-9, p<0.05). (B) MTCC were treated with vehicle or 1 ng/mL LPS for 1, 4, 8, or 24 h (n=9). (C) MTCC were treated with vehicle 1 10 100 1000 ng/mL LPS for 24 h (n=12). (D), mTCC we, re pre-treated with vehicle 1, or 10 µM NS-398 for 30 min then treated with vehicle or 1 ng/mL LPS (n=9). Media were collected for (B) (C) and (D) KC protein levels were measured by ELISA. Data were analyzed for (B) (C) and (D) using one-way ANOVA with Newman Keuls post-hoc (p<0 05) * indicates a significant difference compared to compared to vehicle. Data represents means ± SEM (normalized to vehicle controls) from 3-4 independent experiments.

