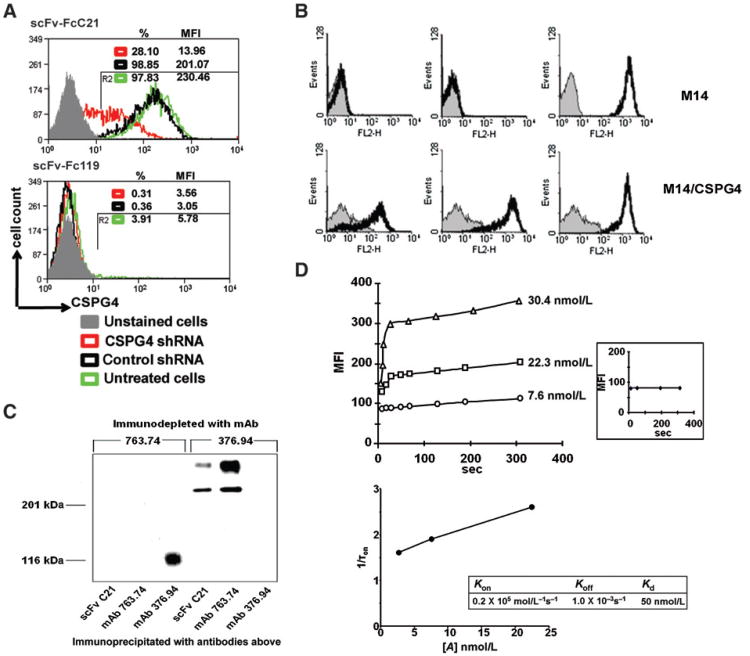
Figure 1.
CSPG4 specificity of scFvC21/scFv-FcC21. A, shRNA knockdown of CSPG4 expression resulting in reduced binding activity of scFv-FcC21. MV3 cells were transduced with either CSPG4-specific shRNA lentiviral particles or ABCB5-specific shRNA, which was used as a control. After 72 hours of lentiviral transduction, cells were harvested and stained with scFv-FcC21 (1 μg/100 μL) followed by incubation with RPE-goat anti-human IgG antibodies. scFv-Fc 119 was used as an isotype control. Cells were analyzed by flow cytometry. %, percentage of positive cells; MFI, mean fluorescence intensity. B, differential staining by scFv C21 of CSPG4+ M14/CSPG4 melanoma cells and CSPG4− parental M14 melanoma cells. M14/CSPG4 transfectants and parental CSPG4− M14 cells were incubated on ice with periplasmic preparation scFv C21 and mAb 9E10 (thick black line) and control periplasmic preparation scFv 119 and mAb 9E10 (thin gray line; left), with CSPG4-specific mouse mAb 763.74 (0.5 μg; thick black line) and isotype control mAb MK2-23 (thin gray line; middle) and with HLA class I antigen-specific mAb TP25.99 (thick black line) as a positive control and mAb MK2-23 as an isotype control (thin gray line; right). Binding of antibodies was detected using RPE-labeled F(ab′)2 fragments of goat anti-mouse Ig antibodies. Cells were analyzed with a FACScan flow cytometer. C, structural relationship between molecules recognized by scFv C21 and by CSPG4-specific mouse mAb 763.74 in a CSPG4+ Colo38 cell lysate. A 1% NP-40 extract of 125I-labeled Colo38 cells was immunodepleted with mAb 763.74. The immunodepleted cell extract was immunoprecipitated with insolubilized mAb 763.74 and scFv C21. Antigens were eluted and analyzed by SDS-PAGE in an 8% polyacrylamide gel. Gels were fixed, dried, and autoradiographed for up to 1 day at −80°C. A 1% NP-40 extract of 125I-labeled Colo38 cells immunodepleted with B7-H3-specific mouse mAb 376.94 was used as a specificity control. D, binding kinetics of scFv-FcC21 to MV3 cells measured by flow cytometry. MFI was measured at indicated times after mixing the complex of scFv-FcC21 (7.6, 22.3, and 30.4 nmol/L)/PE-secondary antibody with MV3 cells (top). Inset, MFIs were measured at indicated times after mixing the complex of scFv-Fc119 (30.4 nmol/L)/PE-secondary antibody with MV3 cells. The microscopic rate constants of the first-order binding reaction are related to the time constant of the fluorescence increase by 1/τon = koff + [A] × kon. The linear regression line shows the relationship between 1/τon (τon: time constant) and [A] (the concentration of antibody; bottom).

