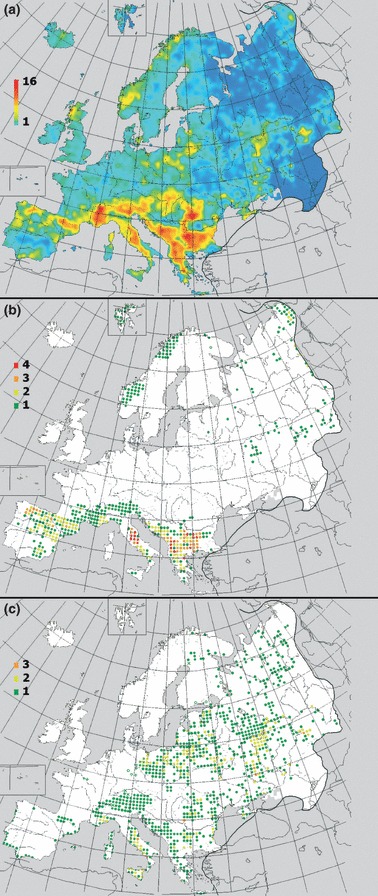
Figure 3.

Species richness maps for perennial Silene species. (a) Distribution of all Silene species classified as perennial in the herbarium survey and included in the Atlas Florae Europaeae database (n = 104). (b) Distribution of the 10 most diseased Silene species, identified by the most significant positive deviations from expected number of diseased specimens based on binomial distribution probabilities. (c) Distribution of 10 Silene species with the largest number of examined species but where no disease was found. Color scales represent the numbers of overlapping species.
