
Figure 1.
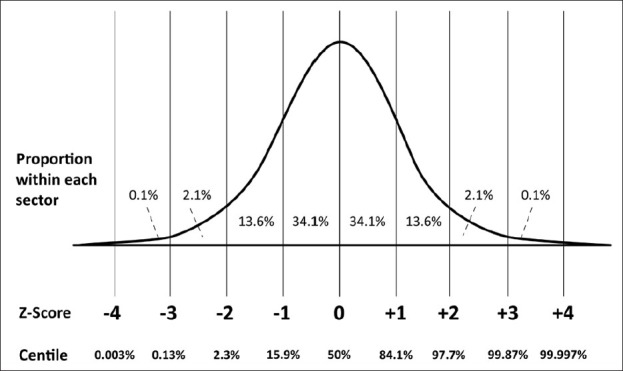
The relationship of Z-scores and centiles, assuming Normal distribution of the parameter. Note that the centile remains virtually constant at values distant from the mean (typically over 3 standard deviations from the mean), whilst the Z-score continues to be sensitive to changes in measurements