
Figure 2.
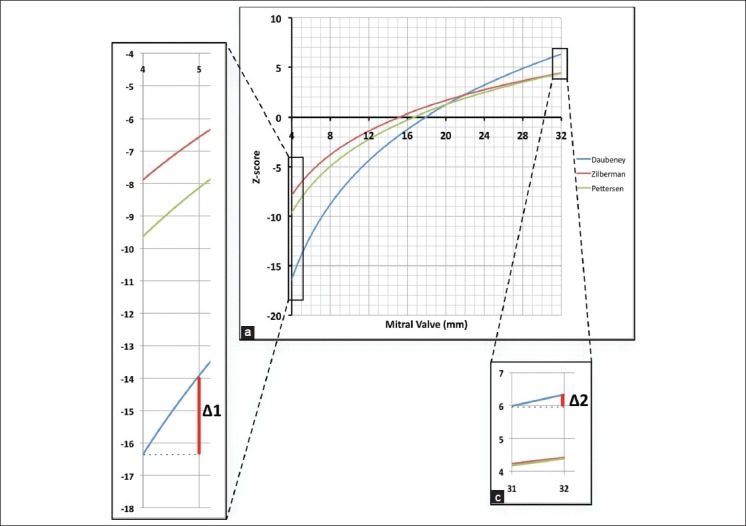
(a) demonstrates the relationship between mitral valve size in mm and the Z-score as derived by the three most commonly used algorithms. Values are calculated for a typical one year old male, weight 10kg, height 75 cm. The algorithms agree relatively closely around the mean (Z=0). (b) and (c). There is considerable discrepancy between the different algorithms, particularly at low Z-scores. Δ1 and Δ2 demonstrate the difference in magnitude of the change in Z-score, with a 1mm variation in measurement, at low and high Z-scores respectively