Figure 2.

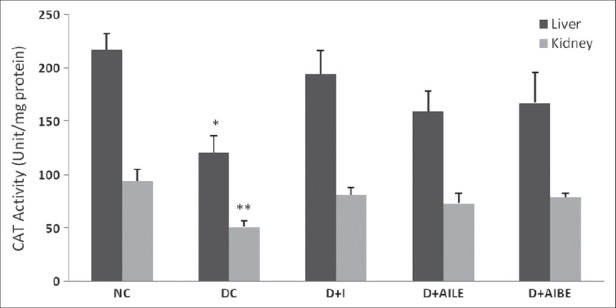
Change in the activity of catalase in liver and kidney of control, diabetes-induced, and diabetic rats after 21 days of treatment. Results are expressed as mean±SEM of five separate experiments. *P<0.05, **P<0.01 vs normal control

Change in the activity of catalase in liver and kidney of control, diabetes-induced, and diabetic rats after 21 days of treatment. Results are expressed as mean±SEM of five separate experiments. *P<0.05, **P<0.01 vs normal control