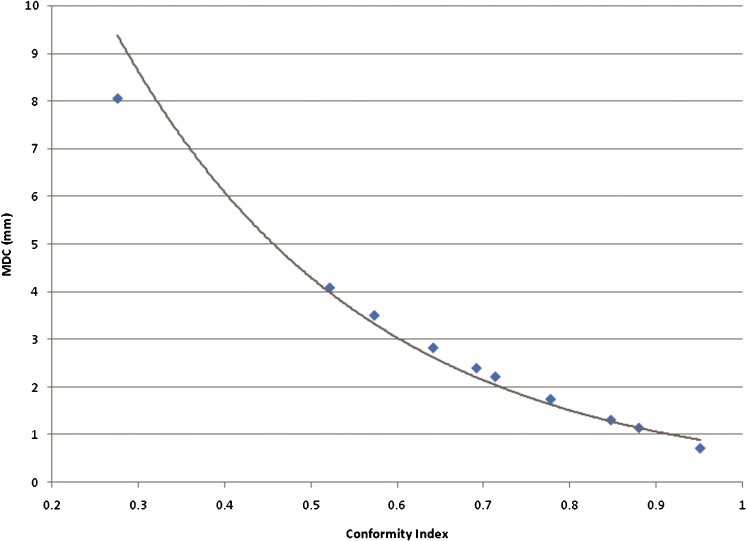
Figure 5.
Graph showing the variation of mean distance to conformity (MDC) with change in Conformity Index (CI) for two spherical volumes. The trendline shows a near exponential relationship between MDC and CI. Assuming a threshold CI of 0.85 as an acceptable standard, this equates to a threshold MDC of 1.6 mm.

