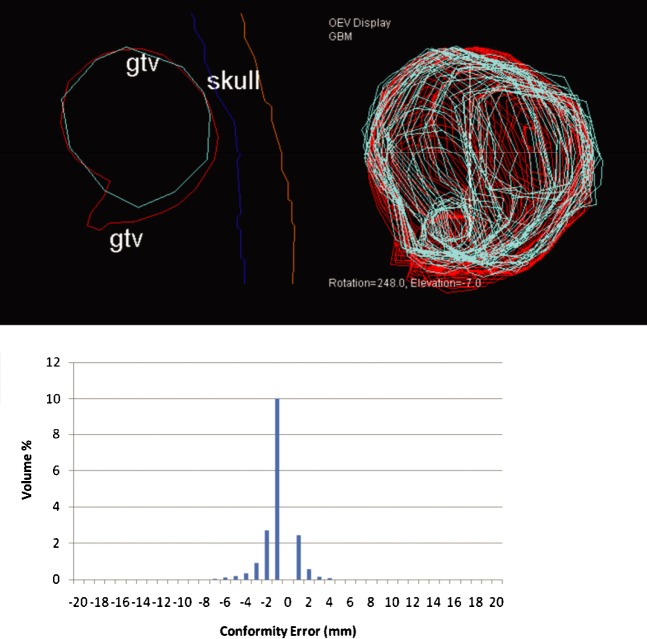
Figure 8.
Representative slice and error–volume histogram from Delegate 2. This delegate tends to under-contour, as shown in the treatment planning system (reference outline is red; delegate outline is cyan). This is confirmed by the left shift of the error–volume histogram. gtv, gross tumour volume.

