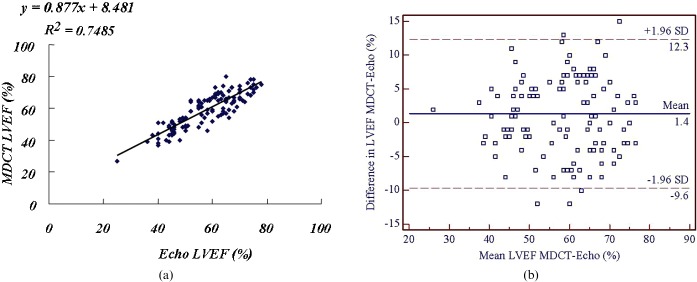
Figure 2.
(a) Linear regression plot shows the correlation between left ventricular ejection fraction (LVEF) measured by 64-slice multidetector CT (MDCT) and two-dimensional echocardiography (echo). (b) Bland–Altman plot of LVEF shows the difference between each pair plotted against the average value of the same pair and the mean value of differences ±2 standard deviations (SDs).

