
Table 3.
Mean and Standard Deviation of MB Concentrations in Category B for 1, 4, and 7 Min Light Irradiation
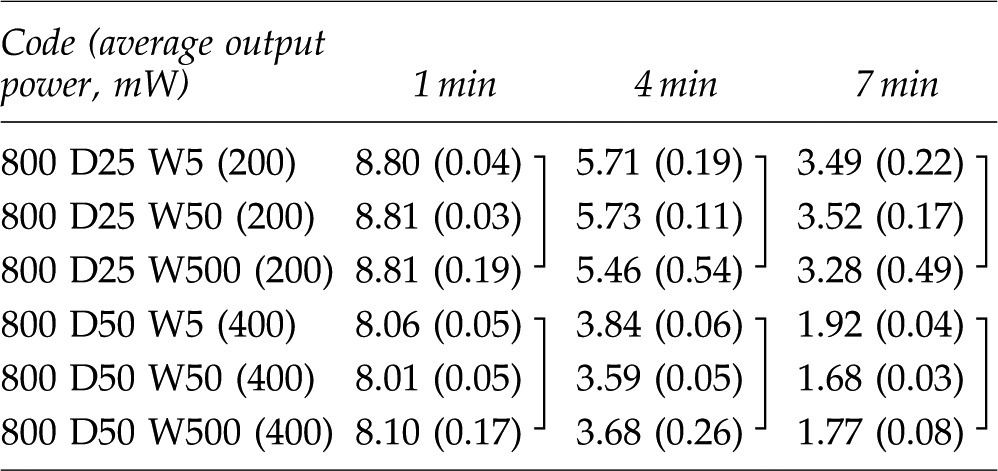 |
The data connected with lines have no statistically significant difference (p>0.05). Mean (±SD), n=3.
MB, methylene blue; D, duty; W, pulse duration (width of pulse).