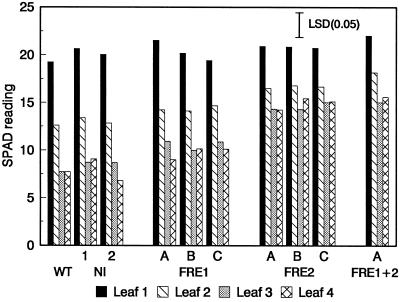
Figure 6.
SPAD leaf readings of control and transformed plants after 10 d in Fe-deficient nutrient solution with 10 mm NaHCO3 and 2 μm Fe-DTPA. Leaf 1 was the lowest leaf included in the measurements and the only fully expanded leaf at the beginning of the experiment; leaf 4 was the uppermost leaf at the completion of the experiment. The lsd (P = 0.05) is indicated by a bar.

