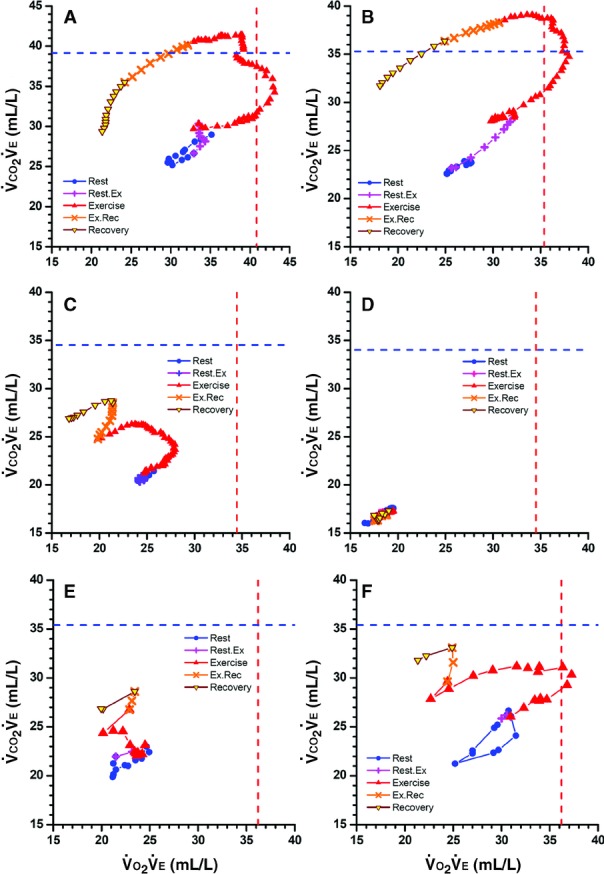
Figure 1.

Displays of concurrent 90-s averages of O2 uptake and CO2 output, both divided by exhaled ventilation ( –versus–
 ) during cardiopulmonary exercise testing from rest through early recovery, with “+” and “×” showing transitions between rest and exercise and exercise and recovery. Vertical and horizontal dashed lines are reference highest
  and highest
  . A, Healthy 38-year-old man with peak
  106% of predicted. B, Healthy 52-year-old woman with peak
  101% of predicted. Note that with exercise, both numerators increase more than denominators until reaching highest
  and then highest
  before rapid declines, especially in
  values, during high-intensity exercise and recovery. C, Fifty-seven-year-old woman (NYHA Class II) with moderate left heart failure, oscillatory breathing, and peak
  63% of predicted. The shape of the early exercise pattern is reasonable, but the highest
  and
and  are well below normal. The rise in
  during the transition to recovery is abnormal. D, Seventy-three-year-old man (NYHA class IV) with peak
  21% of predicted who died several weeks later. All values are very low. The resting, exercise, and recovery values overlay each other and on magnification can be seen to oscillate. Immediate movement to the lower left at the onset of exercise is an ominous pattern. E and F, Left heart failure in 64-year-old man before and after treatment. Raw data were obtained every 30 s rather than 10 s. In E, values move to the left (
 is decreasing) and upward with exercise. After treatment, peak
  values increased from 45% to 66% of predicted. In F, resting values start higher and move upward and to the right (indicating
  is also increasing) before moving leftward. In both studies, the highest
  occurred when
  ≈21 L/min, at which time
  was 25×21=≈520 mL/min (E) and
  was 370×21=≈780 mL/min (F). Thus, this 50% increase in
  from E to F was primarily due to increased perfusion, not increased ventilation.
