
Figure 2.
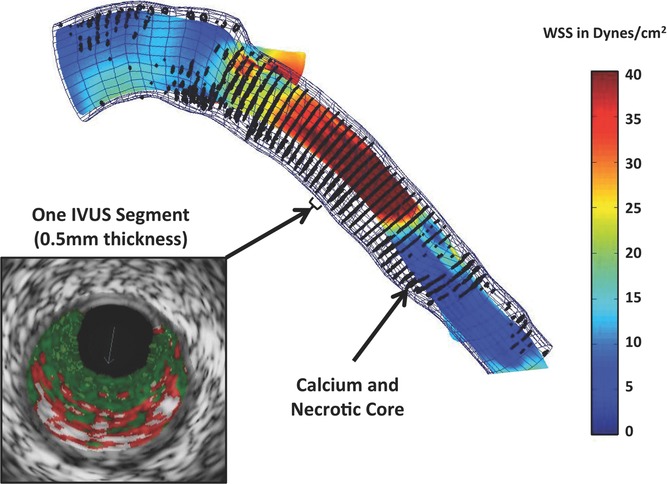
An example of WSS profile of another patient demonstrating heterogeneity of distribution of WSS, which would be difficult to ascertain from geometry alone. The colors represent different values of WSS as depicted in the scale on the right side. Black dots are superimposed VH‐IVUS–derived necrotic core and dense calcium data. A cross‐sectional view of study segment representing 1 VH‐IVUS segment with 0.5‐mm thickness is also shown.