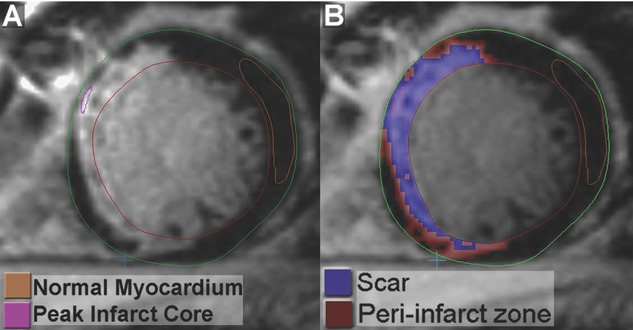
Figure 3.

Endocardial and epicardial borders are drawn; then a large representative area of “normal myocardium” and a small area of “peak scar” are selected as shown in A. Software analysis identifies all voxels with signal intensity >2 standard deviations above “normal myocardium” mean intensity and voxels with signal intensity >50% of the “peak scar” are subtracted from this to obtain the PIZ. Identified voxels that are not in the region of an infarct are discarded.
