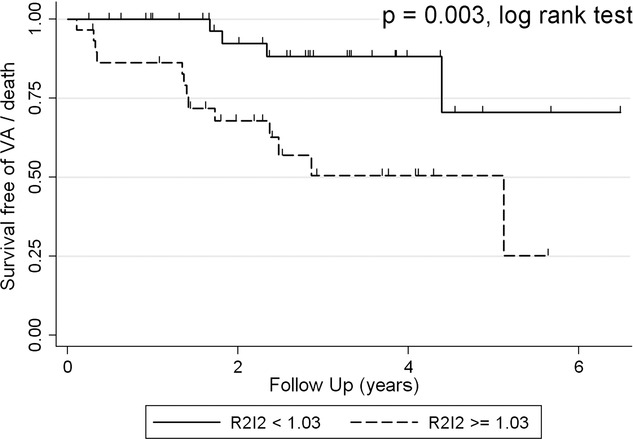
Figure 7.

Kaplan-Meier survival curve for combined Primary Study and Replication groups showing a significantly higher rate of VA in a “high-risk” group with Regional Restitution Instability Index (R2I2)>=1.03 compared with the “low risk” group with R2I2<1.03 (P=0.003, log rank test).
