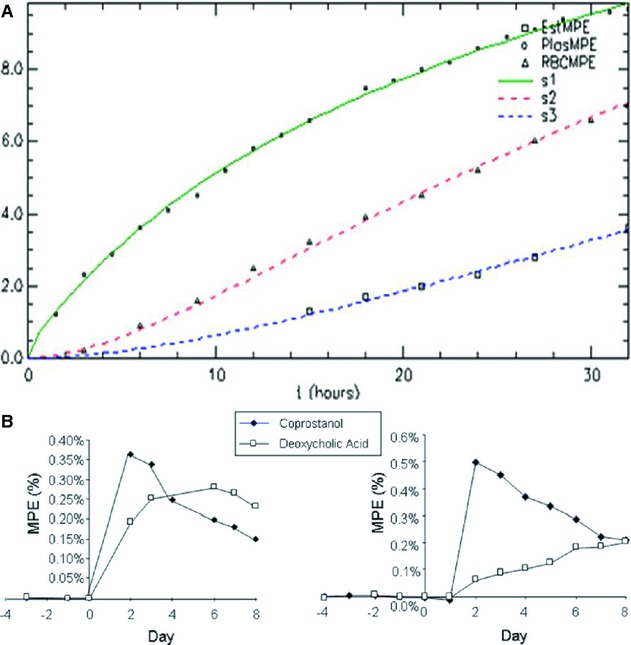
Figure 2.

A, Example of a typical isotope enrichment profiles in plasma FC (circles), RBC FC (triangles) and CE (squares) in subject during a 32-hour isotope infusion. Solid lines represent the SAAM II–generated fits. B, Enrichment profiles in stool for a NS, coprostanol (closed), and a BA, deoxycholic acid (open). Infusion was on day zero, and enrichment was measured in daily stool collections, when available. Preinfusion enrichments were used to determine baseline isotope enrichments, which were subtracted from all subsequent measurements.
