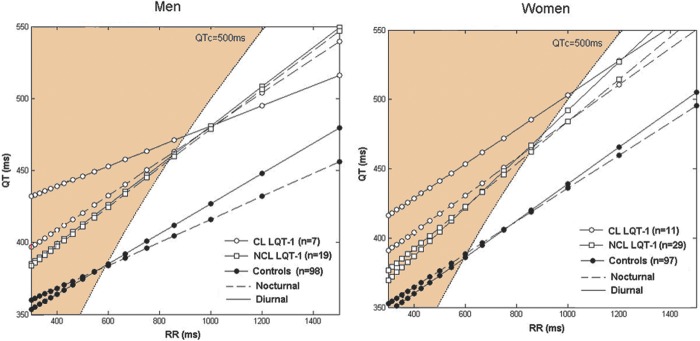
Figure 3.
Sex- and mutation-location–specific QT-RR dynamic profiles in LQT-1 patients. We plotted the QT-RR profiles for men and women across all groups and circadian periods. Curves modeling the QT-interval duration for the controls (black dots), CL QT-1 (white dots), and NCL LQT-1 (squares) groups for the diurnal (lines) and nocturnal (dotted lines) periods are displayed. On average, the CL LQT-1 men have most abnormal QTc prolongation for elevated heart rate (above 70 bpm, RR≤857ms), while the range of heart rate with abnormal QT-interval duration is larger (above 60 bpm, RR≤1000 ms). We superimposed the curve describing QTc=500 ms, and grayed the areas corresponding to the range of RR and QT values associated with higher risk for cardiac events.

