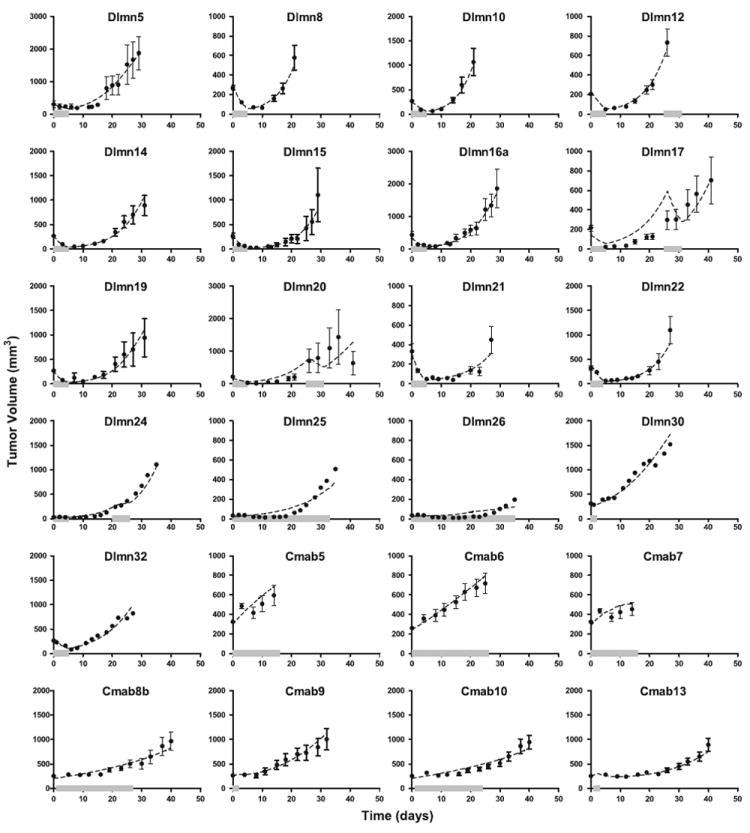
Fig. 2.

The cell signaling-tumor regression model population analysis fits to select dulanermin and conatumumab data. Each panel represents a different treatment group as defined in Appendix A (Tables 3, 4, 5) and shows the average data and fits for all of the animals in that treatment group (or the model fit itself, for treatment groups with only average data available). The solid circles represent the mean of the measured data at each time point for that dose regimen, while the error bars (where present) represent the standard error of the mean at each time point (see Tables 3 and 5 for number of animals). The dashed lines represent the average of the model predictions for each animal in the dosing group obtained using the conditional mean estimated for that animal from the MLEM population analysis. The solid thick grey line along the abscissa represents the duration of drug administration for that treatment group
