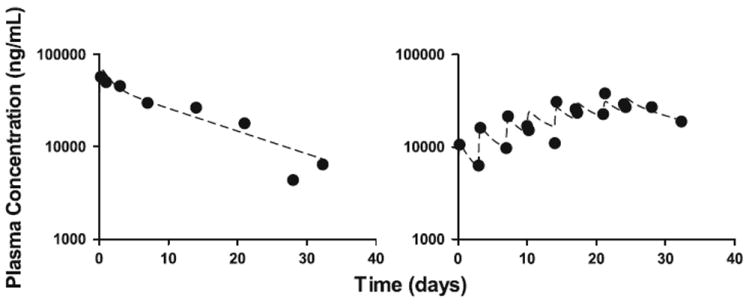
Fig. 5.

Sample model fits (2 of 13 experiments shown) to median plasma concentration data for conatumumab given IP (left panel: single dose of 240 mg; right panel: 36.9 mg given twice weekly for 4 weeks). The solid circles represent the median of the measured data at each time point; the dashed lines represent the estimated model predictions
