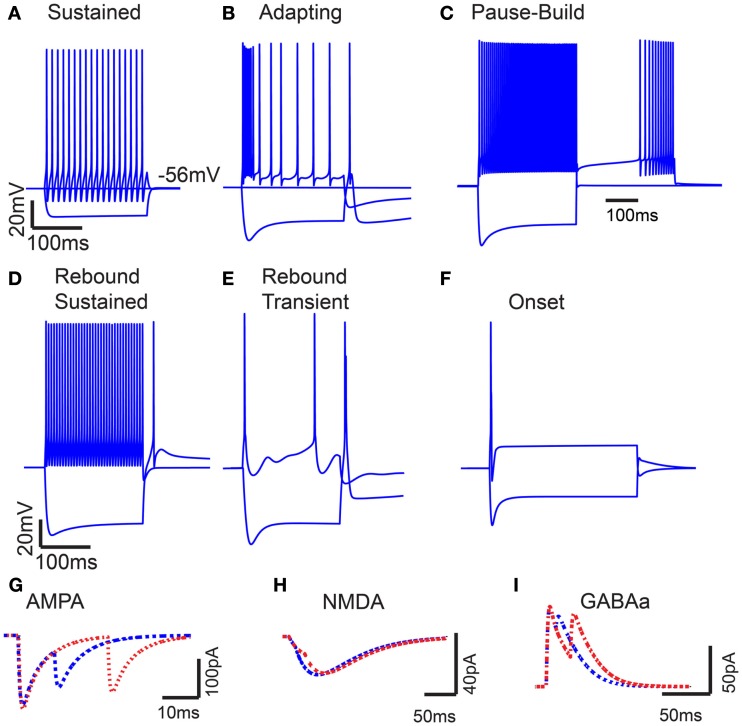
Figure 1.
Model intrinsic and synaptic properties. (A) IC Sustained model response to 200 pA depolarizing and hyperpolarizing current pulses. Voltage traces measured in mV (Y-axis) plotted versus time in ms (X-axis). (B) Adapting model response to 300 pA depolarizing and hyperpolarizing current pulses. (C) Pause-build responses to a 500 pA depolarizing pulse and a negative 500 pA hyperpolarizing current pulse, followed by a 500 pA depolarizing current pulse. (D) Rebound-Sustained response to 500 pA depolarizing and hyperpolarizing current pulses. (E) Rebound-Transient response to 400 pA depolarizing and hyperpolarizing current pulses. (F) Onset response to 800 pA depolarizing and hyperpolarizing current pulses. Y-axis represents voltage traces measured in mV and X-axis represents time in ms for (A–F). (G–I) Current traces of paired post-synaptic AMPA, NMDA, and GABAA currents, respectively. Y-axis represents synaptic current in nA, and X-axis represents time ms. Paired inputs at 10 (blue) and 25 (red) ms ISI to show time course and magnitude of synaptic depression.

