Figure 10.
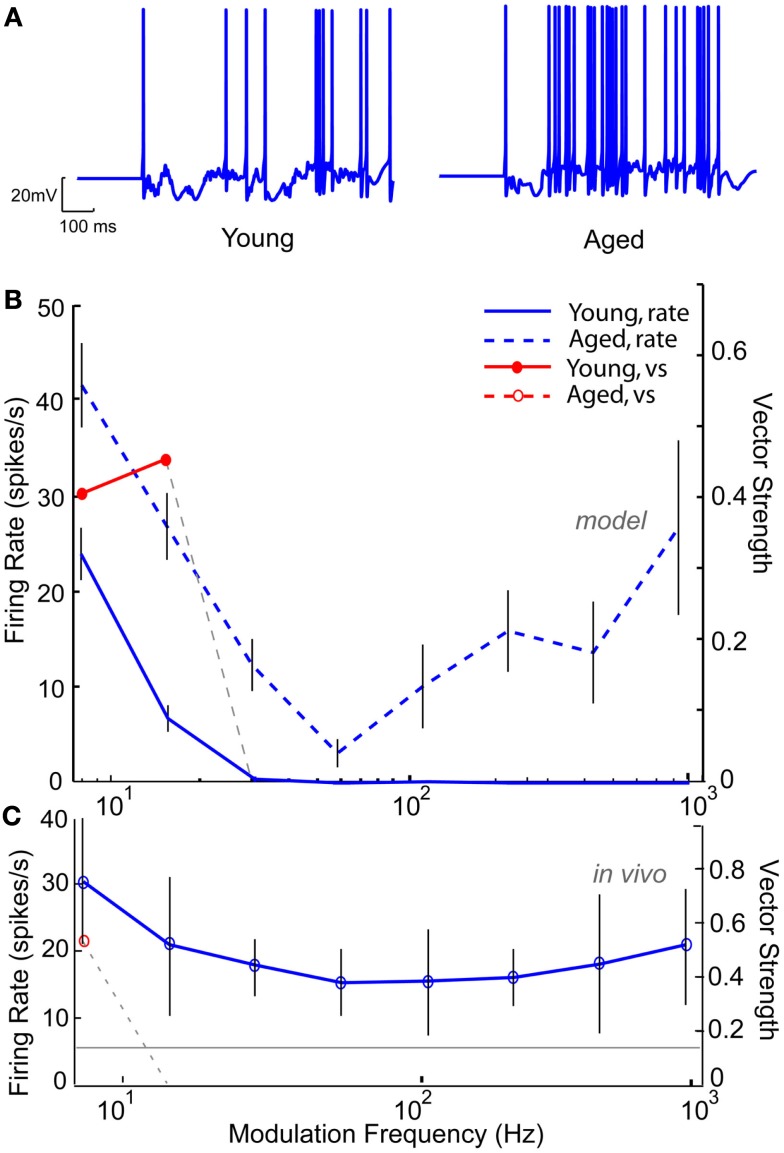
Modeling age-related loss of synchrony through reduction in GABAA. IC Sustained model with two LSO inputs and three DNLL all-pass and the membrane potential at −60 mV. (A) Example voltage traces from individual trials at 16 Hz modulation frequency for a young (left) and aged (right) model neuron. (B) Changes in mean firing rate shown for a young model neuron (blue solid line) and an aged model neuron with 50% reduction in GABAA (blue dashed lines). Significant vector strengths shown for a young model neuron (filled red circles) and an aged model neuron (red open circles, not present in the model). Firing rate, in spikes/s, and vector strength are marked along opposing Y-axes and modulation frequency in Hz is marked along the X-axis. Error bars indicate one standard deviation from the mean of 10 trials. (C) Representative neuron A15 from an aged animal showing a weak low-pass rMTF (blue solid lines) and reduced synchrony (red open circle) to sAM stimuli presented at 75 dB SPL and centered at 16 KHz. Gray line indicates mean spontaneous firing rate. Axes same as (A).

