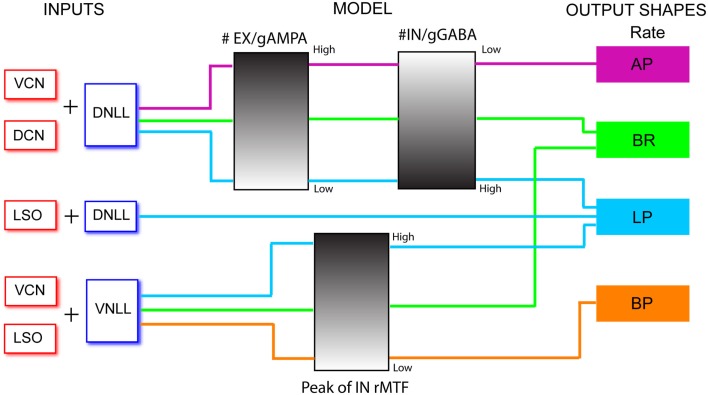
Figure 13.
Model output schematic. Diagram describes possible rate output shapes generated by different combinations of inputs (left) and changes in model parameters (to be read left to right). Excitatory inputs are shown in red boxes and inhibitory inputs are shown in blue boxes. Adjustment of model parameters (center), such as number of excitatory or inhibitory inputs, magnitude of synaptic conductances of AMPA or GABAA, duration of inhibitory post synaptic currents (IPSCs), or frequency of peak inhibitory input rMTF can shape output rate response and lines through gradients indicate magnitude of each parameter. Similar colored lines correspond to different rate output shapes (right) produced by different combinations.

