Figure 4.
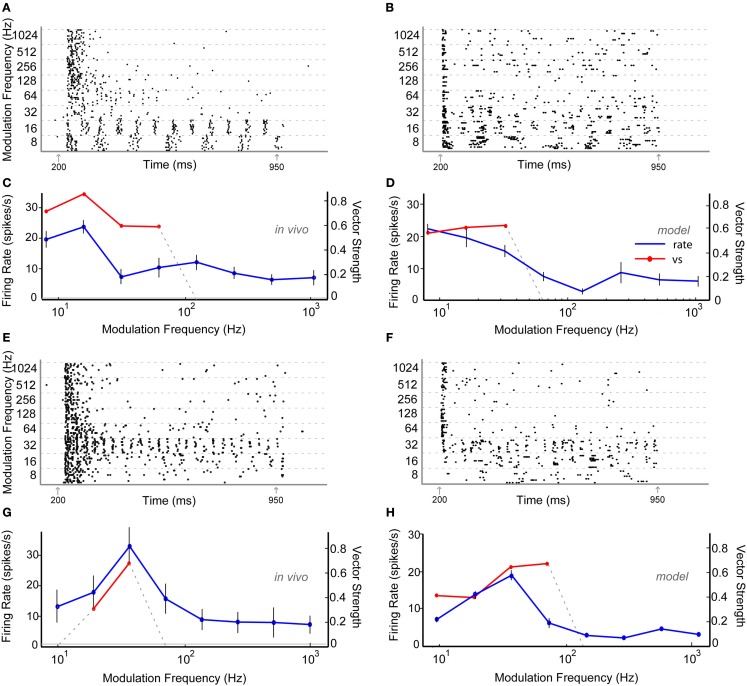
Example in vivo and model neurons exhibiting either low-pass rMTF (A–D) or band-pass rMTF (E–H). (A) Dot-raster plot of responses of unit Y27 from the IC of a young animal to nAM stimuli presented at 65 dB SPL. For this example and other raster examples, modulation frequency is marked along the Y-axis in Hz and time along the X-axis in ms. Each black dot represents a single action potential. Gray arrows indicate beginning and end of sound stimulus. Each modulation frequency shows an aggregation of 10 trials. (B) Dot-raster plot of an Adapting model neuron using 2 VCN and 4 high-pass rate tuned DNLL inputs. (C) Mean firing rate and vector strength of neuron shown in (A) for various modulation frequencies, exhibiting low-pass rMTF and tMTF. Rate in spikes/s (blue) and significant vector strength (red) are marked on opposing Y-axes. Modulation frequency is marked along the X-axis in Hz. Horizontal gray line indicates mean spontaneous firing rate. Error bars indicate 1 standard deviation from mean firing rate. (D) Adapting IC model neuron using inputs described in (B) showing mean firing rate (blue) of 10 trials, and significant vector strength (red). Axes similar to (C). (E) Dot-raster plot of responses of unit Y30 from the IC of a young animal to nAM stimuli presented at 75 dB SPL. (F) Dot-raster plot of a Sustained model neuron using three user-defined low-pass excitatory inputs with six low-pass inhibitory inputs, each with corner frequencies at 32 Hz. (G) Mean firing rate and vector strength of neuron shown in (E) for various modulation frequencies, exhibiting band-pass rMTF and tMTF. Axes similar to (C). (H) Mean firing rate and vector strength of model neuron described in (F) for various modulation frequencies, showing mean firing rate (blue) of 10 trials, and significant vector strength (red). Axes similar to (G).

