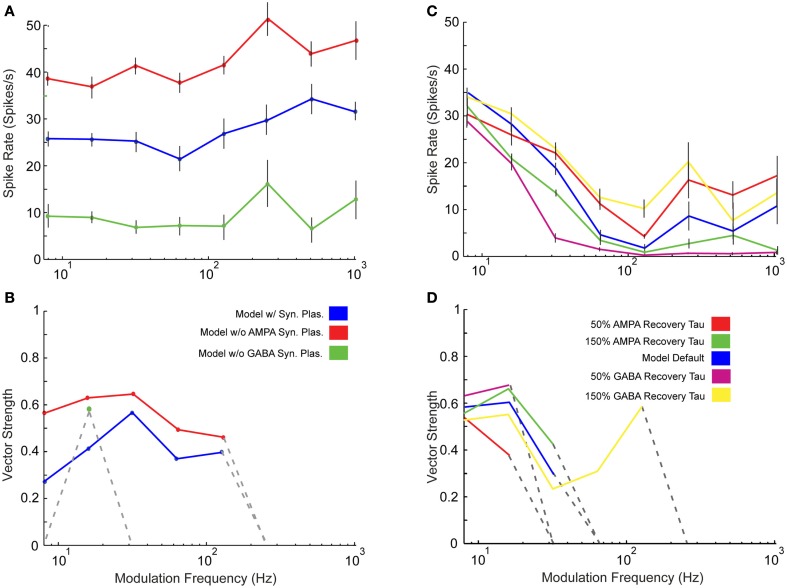
Figure 6.
Effects of synaptic plasticity on model responses. Changes in rate (A) and statistically significant vector strength (B) with modulation frequency in IC Adapting Model responses with 3 DCN and 2 DNLL all-pass inputs in the presence of synaptic depression (blue), the absence of only AMPA synaptic depression (red) or the absence of only GABAA synaptic depression (green). Changes in rate (C) and statistically significant vector strength (D) responses with modulation frequency in IC Adapting model with 2 VCN and 4 DNLL high-pass inputs under normal GABAA and AMPA recovery time constants (blue), 50% reduction in AMPA (red) or GABAA (purple), or 150% increase in AMPA (green) or GABAA (yellow) time constants. Synchrony range is increased with longer recovery time but decreased with shorter recovery time. Modulation frequency in Hz is marked along the X-axes for (A–D), mean firing rate in spikes/s is marked along the Y-axes in (A,C) and vector strength is marked along the Y-axes in (B,D).

