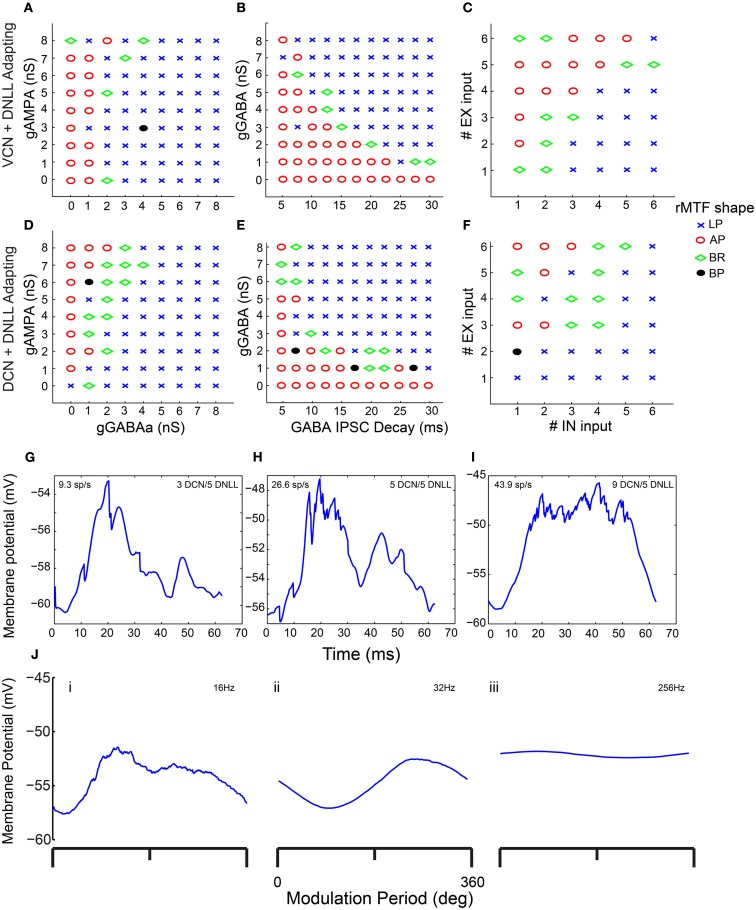
Figure 7.
Determinants of IC Model output and rMTF shape. Color plots showing various rate MTF response shapes using 4 VCN excitatory and 4 DNLL high-pass inhibitory (A–C) inputs with the IC Adapting model. LP – low-pass (blue crosses), AP – all-pass (red circles), BR – band-reject (green diamonds), BP – band-pass (black circles). (A) Rate shape plots as a result of adjusting GABAA synaptic conductance (nS, X-axis) and AMPA synaptic conductance (nS, Y-axis). (B) Rate shape plots corresponding to changes in GABAA ISPC decay (ms, X-axis) and GABAA synaptic conductance (nS, Y-axis) (C) Rate shape plots corresponding to changes in number of inhibitory (X-axis) and excitatory (Y-axis). (D–F) Color plots similar to (A–C), using 4 DCN and 4 DNLL high-pass inputs in the Adapting model. (G–I) Voltage traces taken from a single trial, divided into 62.5 ms intervals (16 Hz) and averaged. Mean voltage trace from a trial using 3 DCN and 5 DNLL high-pass inputs (G), 5 DCN and 5 DNLL high-pass inputs (H), or 9 DCN and 5 DNLL high-pass inputs (I). Membrane potential is marked along the Y-axis in mV and time is marked along the X-axis in ms. (J) Voltage traces taken from a single trial, divided into either 62.5 ms (16 Hz, i), 15.6 ms (64 Hz, ii) or 3.9 ms (256 Hz, iii) intervals and averaged. Mean voltage traces using 3 DCN and 5 DNLL high pass inputs. Membrane potential is marked along the Y-axis in mV and modulation period is marked along the X-axis in degrees.

