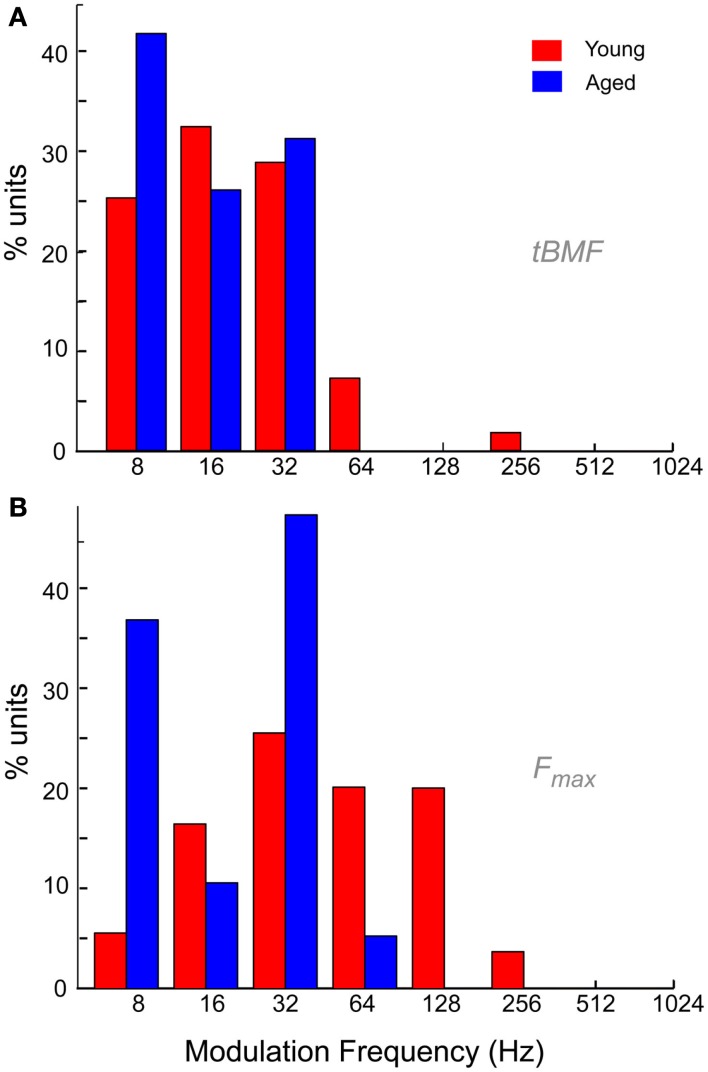
Figure 9.
Temporal characteristics of IC neurons from young and aged animals. (A) Distribution of best temporal modulation frequencies (tBMFs) in young (red) and aged (blue) animals among the recorded neurons in this study. Modulation frequency is marked along the X-axis in Hz and Y-axis indicates percentage of units with specified tBMF. (B) Distribution of temporal cut-off frequencies (Fmax) in young (red) and aged (blue) animals among the neurons recorded in this study. Axes same as (A).

