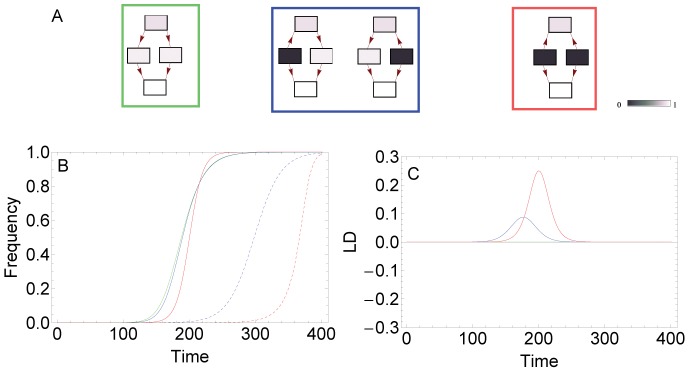
Figure 2. Dynamics in the two-locus model.
Panel A shows four two-locus fitness landscapes with no LFG, one LFG (strong sign epistasis) and two LFGs (strong reciprocal sign epistasis). In B, the frequency of the fittest genotype is shown for the three types of fitness landscapes (green: no LFG, blue: one LFG, red: two LFGs), without recombination (solid lines) and with recombination (dashed lines). Plot C shows the corresponding LD dynamics of the three fitness landscapes without recombination. Parameters take the values  .
.

